
This is my second color splash. We made the color splashes on a web site called Fotor. Fotor is a web site that allows you to edit pictures.
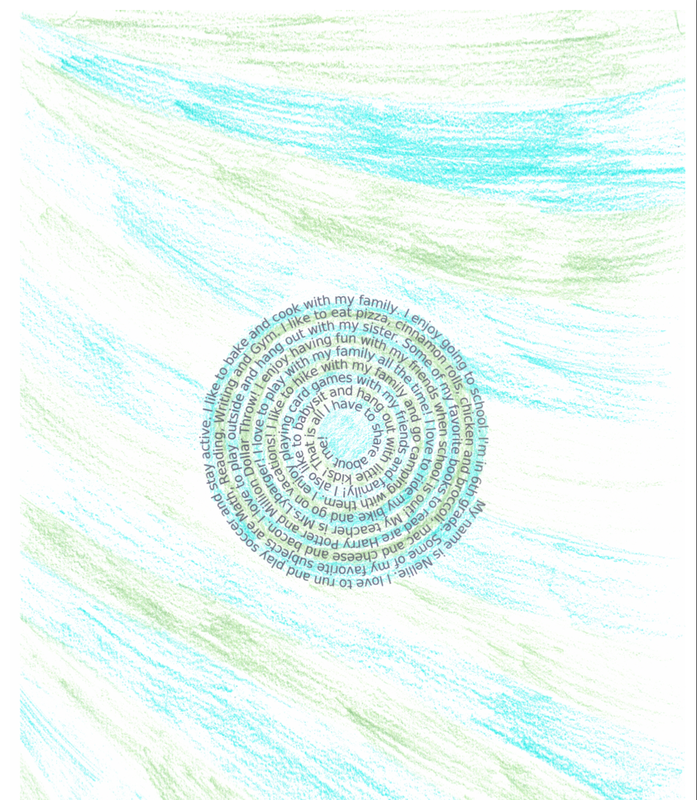
This was an all about me circle that I created in ICT class. This circle has sentences about me and what I like to do! The way we created these are we went on a website and typed in a paragraph about ourselves. Then it made it in to a swirly design that we could then print out and color!
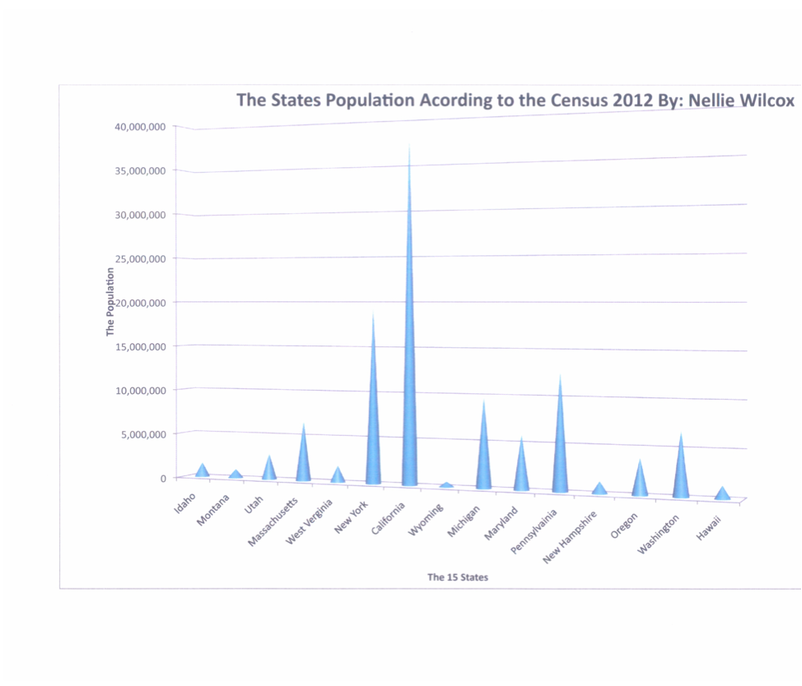
This is a graph that I made in ICT. It shows populations of 15 different US states. I made this graph on Excel. I got all my information from a census. This project was a lot of fun I learned how to use Excel!
